Easy Diagrams as Code system using LLMs.
Visual documentation is a powerful tool for collaboration. It’s easy to consume and communicate with, but creating and maintaining high-quality visual documentation can be challenging. Many teams struggle with outdated diagrams, inconsistent styles, and the difficulty of keeping documentation aligned with rapidly evolving systems. This often results in abstract, unclear diagrams that raise more questions than they answer.
Enter Diagrams as Code and Large Language Models (LLMs)—a powerful combination that addresses these challenges and transforms the way teams approach visual documentation. This approach offers several key benefits:
- Version Control: Track changes and maintain a history of diagrams using existing systems.
- Automation: Keep diagrams up-to-date by integrating them into CI/CD pipelines.
- Consistency: Ensure uniform styles and notation across the organization.
- Collaboration: Facilitate contributions and reviews using familiar code review processes.
- Rapid Creation: Generate complex diagram code quickly with LLMs.
- Iterative Refinement: Use AI assistance to refine diagrams efficiently.
Implementation Guide
Step 1: Set Up a Diagram-As-Code Workflow
Diagrams as Code allow you to store, version control, and modify diagrams just like any other code. Here’s how to get started:
Choose a Tool: Select a Diagrams as Code tool that suits your team’s expertise. For Python users, tools like Python Diagram As Code are a good fit. Alternatively, tools with domain-specific languages (DSLs), such as D2Lang, are excellent choices. Opt for an open-source, stable tool that can be used consistently across projects.
Set Up a Repository: Create a dedicated repository for your diagrams. Organize it in a way that aligns with your team’s structure—by team, component, or another logical grouping. Follow your established CI process for this repository.
Build a Pipeline: Create a build pipeline to compile your diagrams and make them accessible. For example, you can use an S3 bucket to host your diagrams or leverage your repository’s public/internal hosting capabilities. The goal is to serve diagram image files over HTTP.
Here’s an example GitHub Actions pipeline for compiling .d2 files (D2Lang) into SVGs and uploading them to S3:
name: D2 Processing and S3 Upload

on:
  push:
    branches:
      - main
  pull_request:
    branches:
      - main

jobs:
  process-and-upload:
    runs-on: ubuntu-latest

    steps:
    - name: Checkout code
      uses: actions/checkout@v3

    - name: Install d2
      run: |
        curl -fsSL https://d2lang.com/install.sh | sh -s --
        echo "$HOME/.d2/bin" >> $GITHUB_PATH

    - name: Get changed files
      id: changed-files
      uses: tj-actions/changed-files@v35
      with:
        files: '**/*.d2'

    - name: Process changed files and upload to S3
      env:
        AWS_ACCESS_KEY_ID: ${{ secrets.AWS_ACCESS_KEY_ID }}
        AWS_SECRET_ACCESS_KEY: ${{ secrets.AWS_SECRET_ACCESS_KEY }}
        AWS_DEFAULT_REGION: 'ap-south-1'
      run: |
        for file in ${{ steps.changed-files.outputs.all_changed_files }}; do
          output_file="${file%.*}.svg"
          d2 --theme=300 --dark-theme=200 -l elk --pad 0 "$file" "$output_file"
          aws s3 cp "$output_file" "s3://substack-demo-diagrams"
        done
Once this is set up, you’re ready to start creating diagrams.
Step 2: Use LLMs to Generate Diagram Code
LLMs, such as Claude-Sonnet 3.5 or ChatGPT, are excellent tools for generating diagram code. Simply provide a clear prompt describing the diagram you need. For example:
Prompt:
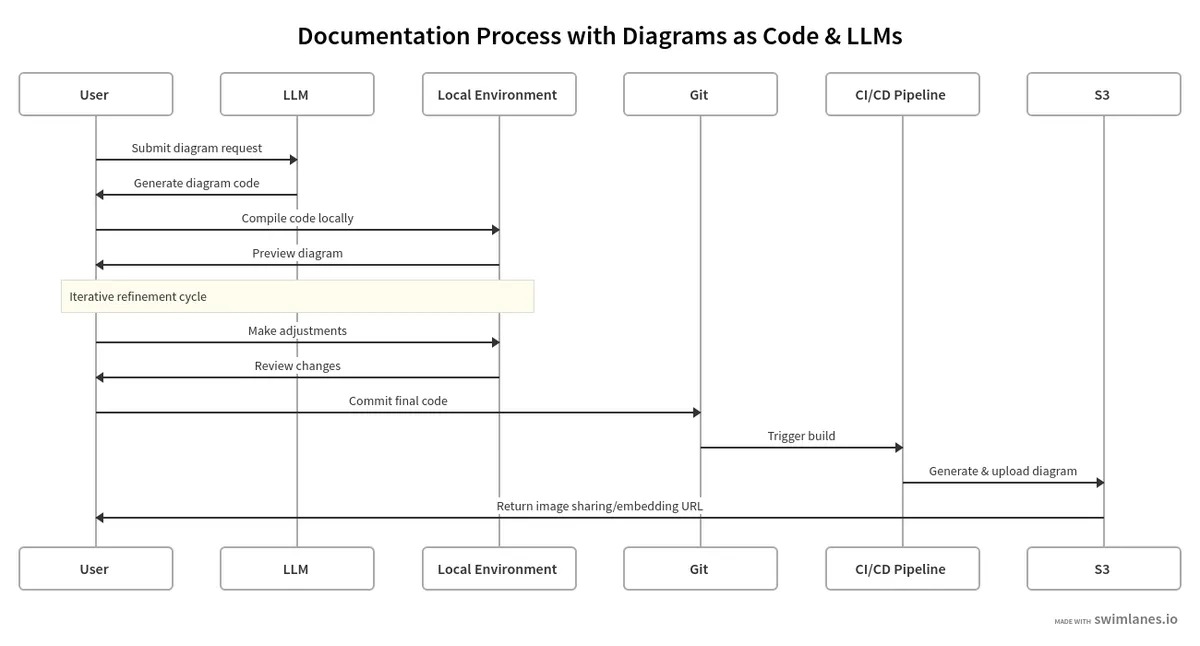
"Create a D2Lang sequence diagram for the following process:
- A user provides a 'prompt' to an LLM.
- The LLM generates diagram code.
- The user compiles the code locally and iterates.
- Once satisfied, the user commits the code to a Git repository.
- A build pipeline runs on commit, generating and uploading the diagram to an S3 bucket.
- The user shares the S3 URL."
The LLM will generate code like this:
shape: sequence_diagram
user: User
llm: LLM
laptop: Local Laptop
git: Git Repository
pipeline: Build Pipeline
s3: S3 Bucket

user -> llm: 1. Provides prompt
llm -> user: 2. Creates diagram code
user -> laptop: 3. Compiles code and iterates
user -> git: 4. Checks in satisfied code
git -> pipeline: 5. Triggers on commit
pipeline -> s3: 5. Builds and uploads diagram
s3 -> user: 6. Copies URL to share

style {
  stroke: "#333333"
  fill: "#f5f5f5"
  font-size: 14
}

user.style.fill: "#e1f5fe"
llm.style.fill: "#fff9c4"
laptop.style.fill: "#e8f5e9"
git.style.fill: "#fce4ec"
pipeline.style.fill: "#fff3e0"
s3.style.fill: "#e8eaf6"
Compile the code using your chosen tool to generate the diagram. Iterate on the prompt until the diagram meets your needs. Once finalized, commit the diagram code to your repository and let the pipeline handle the rest.
Integrating Diagrams as Code into DevOps Workflows
The true power of this system lies in its integration with your existing workflows. Here are some ways to maximize its impact:
- Continuous Integration (CI): Automatically generate diagrams as part of your CI pipeline, ensuring they stay in sync with code changes.
- Version Control: Store diagrams alongside your application code in Git, enabling easy tracking, branching, and merging.
- Code Reviews: Include diagram updates in code reviews to promote collaboration and accuracy.
- Continuous Deployment (CD): Deploy updated diagrams to documentation systems or shared storage as part of your CD process.
- Documentation Integration: Embed diagrams into tools like Confluence or README files for seamless updates.
- DevSecOps: Use diagrams to visualize security considerations throughout the development lifecycle.
- Agile Workflows: Incorporate diagram updates into sprint planning or retrospectives to reflect evolving system architectures.
- Collaboration Platforms: Share diagrams via Slack, Microsoft Teams, or similar tools to improve team communication.
By combining Diagrams as Code with LLMs, you can revolutionize your team’s approach to visual documentation. This system not only saves time but also ensures consistency, accuracy, and collaboration across your organization.
If you have any questions or need help implementing this for your team, feel free to reach out.
Resources: